Quality of drinking water
The EU monitors Member States’ water quality with regard to drinking water and bathing water. In the comparison of drinking water quality, the results of all Member States meet the quality requirements set by the EU at 99-100%.[1]
The purpose of the Council Directive (98/83/EC) on the quality of water intended for human consumption, which came into force at the end of the 1990s, is to protect human health by ensuring healthy and clean water quality. The Directive lays down quality requirements for both microbiological and chemical parameters. The microbiological quality of drinking water has direct and immediate effects on human health. The effects of chemicals or other contaminants do not appear, for example, as a sudden wave of illness, but may emerge as the result of long-term exposure. However, the quality requirements of the Directive have been set to ensure that the microbiological and chemical quality of drinking water does not have harmful health effects, even after long-term use.
In the Netherlands, drinking water is not chlorinated, but chlorine disinfection is used in other parts of Europe. In Finland, too, all surface water plants and even several groundwater plants use chlorine disinfection. From the viewpoint of the food industry, the use of chlorine compounds (sodium hypochlorite, chlorine dioxide, chloramines) is both advantageous and disadvantageous: the potential residual flavour makes it unwelcome, but the chemicals prevent the growth of microbes.
The microbiological quality of drinking water is generally high in Europe. Drinking water purification processes eliminate all health-damaging microbes from raw water, making drinking water safe for users. The quality comparison of drinking water in the EU is based on parameters that are monitored in drinking water on the basis of the Directive. For example, the limit value for pesticides (0.10 μg/l) is very strict and set on ecological grounds. The concentrations that may cause health hazards for water users can be multiple times above this limit, as stated in the WHO guidelines.
Compliance with the limit values is almost 100% in each Member State. In the EU, pesticide residues in water are examined by country within the framework of chemical quality standards. In Finland, all monitoring results in 2015 complied with the parametric values set for pesticides.
If, besides microbes, concentrations of sweeteners or certain chemicals, such as medicinal substances or flame retardants, were monitored more stringently and systematically, the comparative results would probably be much more favourable to Finland, as these correlate directly with the population and, conversely, with the available water resources.
Compliance rates at national level in the Member States (2011-2013)
| Microbiological parameters | Chemical parameters | Indicator parameters* | |
| Austria | 99,84 | 99,9 | 99,6 |
| Belgium | 99,75 | 99,9 | 99,1 |
| Bulgaria | 99,25 | 99,5 | 99,3 |
| Cyprus | 99,01 | 99,9 | 96,3 |
| Czech R. | 99,91 | 99,9 | 99,2 |
| Germany | 99,88 | 99,9 | 99,7 |
| Denmark | 99,8 | 99,8 | 98,6 |
| Estonia | 99,99 | 99,8 | 99,1 |
| Spain | 99,62 | 99,8 | 99,4 |
| Finland | 100 | 99,9 | 99,6 |
| France | 99,84 | 99,8 | 99,4 |
| Greece | 99,64 | 99,9 | 99,5 |
| Hungary | 99,71 | 98,6 | 97,1 |
| Ireland | 99,97 | 99,5 | 99,3 |
| Italy | 99,2 | 99,6 | 99,6 |
| Lithuania | 100 | 99,3 | 99 |
| Luxembourg | 99,77 | 100 | 99,5 |
| Latvia | 99,92 | 100 | 98,7 |
| Malta | 100 | 99,9 | 90,1 |
| the Netherlands | 99,97 | 100 | 100 |
| Poland | 100 | 100 | 99,8 |
| Portugal | 99,57 | 99,9 | 99,3 |
| Romania | 99,69 | 99,7 | 99,2 |
| Sweden | 99,94 | 100 | 99,1 |
| Slovenia | 99,25 | 100 | 98,7 |
| Slovakia | 99,52 | 100 | 99,4 |
| United Kingdom | 99,98 | 99,9 | 99,9 |
Source: European Commission, Drinking water reporting requirements and synthesis reports. pp. 12-13, Link to report *except odour, taste colour and turbidity
Quality of bathing water
The surface water status used to be poor in Finland due to industrialisation in the 1960s, but its quality has since improved significantly due to wastewater treatment measures. In a comparison of the microbiological quality of bathing waters during four bathing seasons, Finland’s ranking is still average, similar to that of other Baltic Sea countries, including Sweden, Poland and the Baltic countries. This survey indicates that the quality of bathing waters on Finnish coastal beaches is lower than that of inland beaches, which affects the country’s performance and the comparison between Member States. Under the EU Bathing Water Directive (2006/7/EC), bathing water is classified as ‘Excellent’, ‘Good’, ‘Sufficient’ or ‘Poor’.
The results for Finland tend to reflect any high microbial concentrations in bathing water due to individual pollutants. The water masses in the Baltic Sea are small compared to the Mediterranean basin, for example, and water turnover may be low close to beaches. Individual polluters, such as large forest industry units, must now comply with strict limit values and water recycling regulations. As a result of these improvements, large load sources now account for a lower share of the impacts on water quality while the share of smaller individual load sources, such as farms, may have been increased.
With regard to beaches, the situation of inland water bodies, i.e. lakes and rivers, is very good in Finland. However, the average results for the entire country are undermined by several factors. On the coast, the water quality of some individual beaches has been classified as poor at times.
1) Finland has beaches for which the bathing water classification has been impossible to determine, either due to the insufficiently long period of bathing-water quality monitoring (new beaches) or deficiencies in sampling. Bathing water quality must be monitored for four bathing seasons to get a quality status.
2) Coastal beaches are classified as sea areas. Sea waters are subject to much stricter limit values in the EU Directive, because microbes are destroyed more rapidly in salt water. The varying situation on Mediterranean, Atlantic and Baltic Sea beaches is clearly visible in the results for the various countries.
3) The end result is also affected by the deviation of the results, as samples are taken at the same point several times – for example, heavy rain may temporarily flush contaminants into beach waters, creating a peak in microbial results.
Bathing water quality in Europe, (% of water sites with excellent water quality)
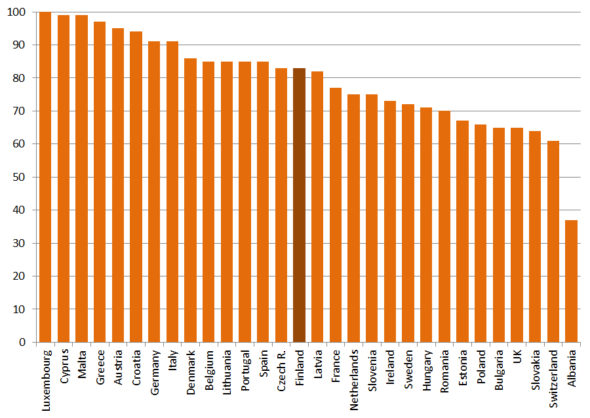
Source: European Commission and Euroopan Environment Agency, Report European bathing water quality in 2016, Link to report
Groundwater quality
Sources of nitrates in water bodies include fertilisers or the decomposition of nitrogenous substances, urban waste waters and the drainage of mires. Nitrogen is among the main plant nutrients not normally present in large quantities in surface water bodies. An abundance of available nitrogen is one of the reasons for the eutrophication of water bodies.
Nitrate in the groundwater in European countries, mg NO3/l
Source: European Environment Agency, Groundwater – nitrate, Link Note: The data series are calculated as the average of annual mean concentrations for groundwater bodies/river stations/lake stations in Europe. Only complete series after inter/extrapolation are included (see indicator specification). The number of groundwater bodies included per country is given in parentheses: 2000-2012: Europe (1242), Austria (14), Belgium (38), Bulgaria (42), Cyprus (4), Czech Republic (63), Denmark (108), Estonia (27), Finland (34), France (220), Germany (217), Ireland (89), Italy (7), Liechtenstein (1), Lithuania (3), Luxembourg (3), Malta (2), Netherlands (9), Norway (1), Portugal (10), Serbia (21), Slovakia (10), Slovenia (4), Spain (158), Switzerland (30), United Kingdom (127).
The only European-level statistical review of nitrate levels in groundwaters is a comparison by the European Environment Agency (EEA), the most recent of which covered the period 2000-2012. In each country, the calculations are based on average values calculated for a few or a few dozen observation points. The number of measurement points was 34 in Finland. The EEA’s statistics easily give a distorted picture for Finland, which requires a detailed explanation.
The geological conditions of groundwater in Finland differ from those in Central Europe. Groundwater bodies are large in other parts of Europe, making it easier to calculate average results, whereas in Finland almost 6,000 groundwater areas are currently surveyed and classified as part of the water supply by the environmental administration. Of these, approximately 36% are important to (Class I) and 28% are suitable for (Class II) the water supply. The rest are other (Class III) groundwater areas. However, groundwater is present everywhere. Of Finland’s total arable land area of 23,154km2, some 5.6% (1,293km2) is located in groundwater areas which are important (Class I) or suitable (Class II) for water supply (10,019km2, Groundwater Register POVET 06/16). Correspondingly, some 13% of the total surface area important and suitable for water supply (Classes I and II) is classified as arable land.[2]
Groundwater quality is generally good in Finland. However, our groundwater aquifers are particularly vulnerable to changes in water quality, because they are relatively shallow, small in area and fairly permeable.[3] Soil layers that protect groundwater are also generally thin in Finland.
Some groundwater areas in Finland are located in the impact areas of agriculture. The latest report by the Finnish Environment Institute SYKE and the Ministry of the Environment publishes the results for the 2012-2015 period for 145 impact areas of agriculture. More than 95% of the mean concentrations were below 25mg/l and the average of the mean values at the observation sites was 7.75mg/l. The average nitrate content of natural or as natural as possible background stations (59 units, 2012-2015) was 1.06mg/l. The differences are significant between the impact areas of agriculture and natural areas, but the overall nitrate content in groundwater has remained virtually unchanged.[4] In international comparison, nitrate levels in groundwaters monitored in Finland tend to be low compared to bodies of groundwater in other parts of Europe (Mitikka et al., 2017, p. 34)
Water reserves
The EU monitors trends in water use in each Member State. The water exploitation index (WEI) is calculated as the ratio of the abstraction of water in each country to its water reserves, including the long term average annual (LTAA) of the difference between annual freshwater accumulation and removal, and groundwater and surface water reserves. The limit value in the index between non-stressed water exploitation and water scarcity is 20%, while the limit for severe water scarcity is 40%.[5] The European Environment Agency’s 2002-2014 dataset gives statistics on water use (WEI) by main water body. The values for the catchment areas of the largest European rivers have varied between 0 and 40%, the highest figures being obtained in the Mediterranean countries and individual catchment areas in Central Europe.[6] In Finland, 3% of our freshwater reserves are used annually, while the same figure may reach 30-50% in certain densely populated regions in Central or Southern Europe. Finland has plenty of unexploited water resources, particularly in relation to its population.
Freshwater resources per inhabitant in the EU member states — long-term average (1 000 m³ per inhabitant)
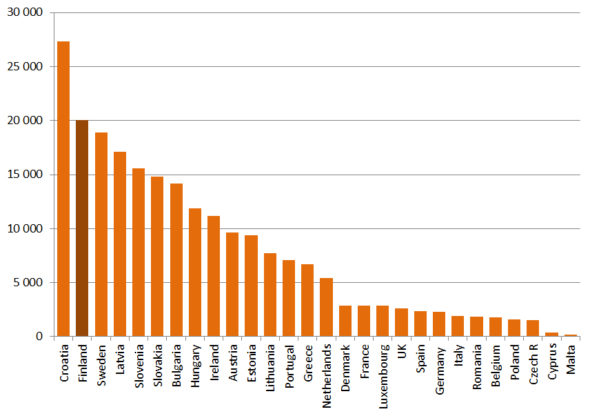
Source: Eurostat, Water statistics, Figure 2, Link to page
Use of water
In 2017, accurate accounting for abstracted water in the Finnish economy was completed[7], covering a total of around 200 sectors and the entire national economy from primary production to industry, services and households. Finland thereby became the first country in Europe to provide detailed information on the quantities of abstracted water, broken down by raw water source, usage and purpose. Discussions have long been held in organisations such as Eurostat on supplementing accounting for the use of energy and other natural resources with accounting for water, but no obligations have been imposed on Member States so far, because water accounting is considered rather laborious. Previous, similar projects implemented in locations such as Australia, Sweden or Denmark have covered a maximum of only 30 sectors while the Netherland recently provided data for about 130 industries.
Water accounting is a prerequisite for research and development related to the value of water, water pollution loads, the regulation of the water supply and economic control measures. Accounting reveals how much surface and groundwater is extracted and used in Finland for various purposes – as domestic water, industrial process water, cooling water and irrigation water – and how the use of extracted water is distributed between the different functions of the national economy. For example, the food industry is one of the most water-intensive sectors in Finland, because it needs a lot of water for each euro it produces. Water accounting facilitates the setting of targets and the monitoring of water use and its efficiency.
Finland’s abundant water resources facilitate their sustainable use in terms of quantity. From this point of view, it makes sense to locate water-intensive production, such as plant cultivation, in Finland. Agriculture accounts for around 5% of the total use of water in Finland, while the worldwide average figure is around 70%.
In some regions, certain industries can cause serious water scarcity. For instance, cultivation of some vegetables and fruits in Southern Europe and subsequently exported to countries like Finland is located in areas with a high water stress. The impacts on water resources of domestic and foreign production should therefore be better integrated into sustainability reviews, alongside issues such as climate impacts.
Database tables
Concentrations of nitrate in groundwater in 2000-2012
Water quality for household consumption in 2011-2013
Water quality of bathing sites with excellent grade in 2016
Long Term Annual Average (LAA) of freshwater resources
References
[1] Source: European Commission, Drinking water reporting requirements and synthesis reports, Link
[2] Mitikka, S. (ed.), Grönroos, J., Kauppila, P., Kauranne, L., Orvomaa, M., Rankinen, S. & Salminen, A. (2017) Nitraattidirektiivin täytäntöönpano Suomessa, Raportointijakso 2012–2015, Helsinki 2017, Finnish Environment Institute and Ministry of Environment, p. 76, Link to report
[3] Meriläinen, P., Salminen, J., Britschgi, R., Nystén, T. & Pitkänen, T. (2017) Esiselvitys yhdyskuntien ja ruoantuotannon veden käytön riskien hallinnasta ja mahdollisuuksista, Working paper 32/2017, National Institute for Health and Welfare, THL
[4] Natural Resources Institute Finland, Nitrate content in surface water and groundwater, Link
[5] Eurostat, Water Exploitation Index, Link
[6] European Environment Agency, Water exploitation index plus (WEI+) for river basin districts, Link
[7] Salminen, J., Tikkanen, S., Koskiaho, J. (2017) Towards water-smart circular economy, Finnish Environment Institute, reports 16/2017, Link to report
Photo in upper edge: Pixabay