Geochemical composition
Soil composition is a complex whole. Geochemical comparative research has been conducted in Europe by the EuroGeoSurveys (Association of Geological Surveys of Europe). The European Geochemical Atlas was completed in the mid-2000s.[1] The most recent comprehensive report focuses on the geochemical composition of European agricultural land and pastures; the compositional analysis is the first of its kind. For the first time, agricultural and pasture soil trace elements and metals were mapped from fully harmonised and quality controlled material [2] throughout Europe.
In 2008 and the first half of 2009, a total of 2,108 samples of agricultural land (ploughed depth of 0-20 cm) and 2,023 samples of permanent pasture (depth of 0-10 cm) were collected. Samples were taken from grids of 50kmx50km, i.e. 1/2,500km2 in 33 European countries in total. The sampling area comprised a total of 5.6 million km2. All of the samples were analysed using aqua regia leaching on dried samples, screened to a grain size of less than 2 mm. The results were published in two books in 2014.[3]
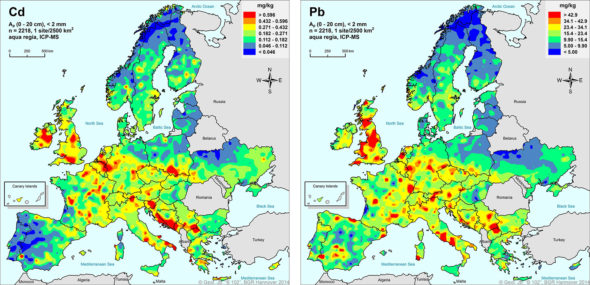
Concentrations of many elements in Northern European soil (e.g. As, Cd, Co, Cu, Mn, Pb) are up to three times lower than in the southwestern and southern parts of Europe. Since concentrations typically change at the southern ice limit of the Ice Age glacier, the main causes of this are directly related to geology. Samples from agricultural and pasture soil have an almost identical geographical distribution of concentrations within Europe, and comparable concentrations of elements. In most cases, areas of elevated metal concentrations can be identified and linked to known mineralised zones and old mining areas.
Cadmium and lead content in the agricultural land of Europe [4]
The marine climate in coastal areas (selenium and sulphur maps) has influenced the formation of selenium or sulphur content.
Selenium and sulphur content in the agricultural land of Europe [4]
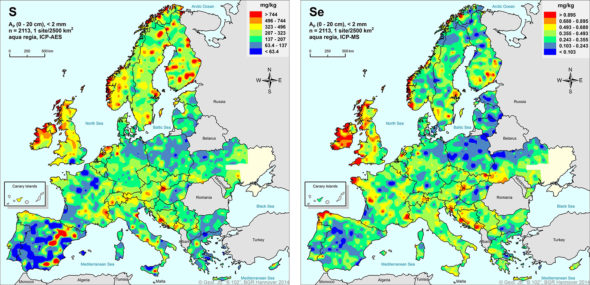
The regional distribution patterns of several elements such as mercury, sulphur and selenium are strongly related to organic soil. Finland, for example, has plenty of peat or marshy arable land that easily binds the above-mentioned substances. Anomalies in Finland, as shown on the TOC map, are explained by the organic carbon content of agricultural land, which easily binds mercury from the air.
Mercury and Total Organic Carbon (TOC) content in the agricultural land of Europe [4]
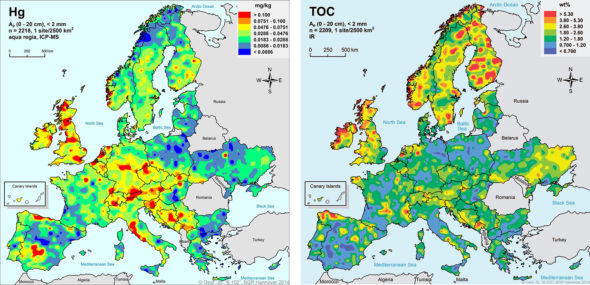
Certain big cities (e.g. London and Paris) stand out on the mercury and lead maps, but the effects of human activity tend not to be reflected in the GEMAS project’s sample network, whose sampling rate was not high. Surveys based on a much higher sampling rate are required for the detection of this. An area of approximately 80kmx60km surrounding Berlin was studied in the 1990s, based on an almost 1 km/km2 sampling rate. The study indicated high levels of cadmium, lead, zinc, copper and mercury in areas hosting metal and steel industries, building materials industries and large farms using sewage-based nutrients.[5]
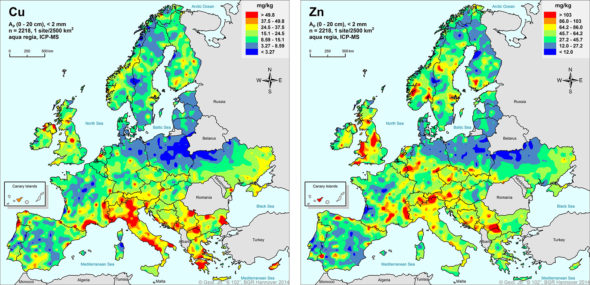
Some metals, such as zinc and copper, are trace elements, small quantities of which are essential to all organisms and humans, but large amounts are harmful. Copper and zinc concentrations in Finnish soil are average at European level. Fluoride in drinking water is another good example of the same phenomenon: fluoride is vital for the teeth, and a supplement may therefore be necessary, but a greater concentration in drinking water could lead to brittle bones.
Copper and zinc content in the agricultural land of Europe [4]
 Based on the results of the GEMAS study, no direct conclusions can be drawn on the heavy metal content of crops cultivated in different European countries. The concentrations determined by the methods used in the study (aqua regia leaching and small grain size) are close to the total levels of elements in the soil, but the accumulation of these in plants may vary by soil type. For example, clay fields are common in the Nordic countries and the metal content of these is naturally high. These metals are not necessarily easily available to plants and various plants absorb trace elements from the soil in different ways. However, the GEMAS maps suggest that higher levels of occurrence of certain metals may be more likely to result in higher concentrations in plants than lower levels.
Substances that accumulate in the soil and substances added to the soil
Fertilisers and pesticides added to agricultural land also affect its purity. In addition to plant protection products (Use of pesticides) and fertilisers, manure from livestock production and various organic fertiliser products, made from substances such as sewage sludge, are applied to the fields.
The heavy metal contents of fertilisers are generally well known. The Finnish Fertiliser Product Decree defines the limit values for heavy metals. Fertilisers may not be sold if concentrations exceed the limit values. The maximum levels of cadmium are also defined at EU level, as cadmium may end up in the soil alongside phosphorous fertilisers, and as fallout in lower quantities. The maximum permissible quantities in fertilisers have varied by country. The Finnish limit value, 22 mg/kg P2O5, is among the strictest in the EU (Finnish Ministry of Agriculture and Forestry decree 24/11, p. 24). The new EU regulation[6] introduces stricter limit values for the cadmium content of phosphorous fertilisers, in order to reduce risks to health and the environment.[7] Phosphate from the Finnish Siilinjärvi mine contains considerably less cadmium than phosphate from most of the world’s major phosphate mines.
The current state of nutrient recycling in Finland was jointly reviewed in spring 2017 by the various LYNET facilities (Natural Resources Institute of Finland (Luke), the Finnish Food Safety Authority Evira, the Finnish Environment Institute SYKE and VTT Technical Research Centre of Finland) (Marttinen et al. 2017). According to the survey, about 17 million tonnes of domestic animal manure is produced annually in Finland. Of this manure, 95% is applied to the fields as fertiliser as is, while the share of processed manure is only 5%. The nitrogen and phosphorus applied to Finnish agricultural land originates from three main sources.
Estimated total use of phosphorus and nitrogen (t/year) in the Finnish agriculture, 2014-2016
| Phosphorus use | Nitrogen use | |
| Inorganic fertilisers | 11,300 | 148,000 |
| Manure | 19,300 | 76,000 |
| Fertiliser products with recycled nutrients | 170 | 4,000 |
| Total (t/year) | 32,300 | 228,000 |
Source: Marttinen, S. et. al. (2017) Kohti ravinteiden kierrätyksen läpimurtoa: Nykytila ja suositukset ohjauskeinojen kehittämiseksi Suomessa, Natural Resources Institute Finland, 45/2017, 45 p. Link to the publication
The quantity of manure produced is proportional to the size of the domestic animal sector in each country – in practice, the number of farm animals. It is standard practice in all countries to spread this manure on fields as fertiliser. Areas of highly intensive livestock production, such as Belgium, the Netherlands or North-Western Germany, must process manure nutrients (e.g. removal of nitrogen into the atmosphere via combusting or biological nitrogen removal) or transport them as such or in processed form across borders, since nutrient supply exceeds the domestic need for manure nutrients and restrictions on spreading manure. Many countries have areas of dense livestock production, where there is regional surplus of manure nutrients. Regional pressure has arisen also in Finland as a result of the concentration of livestock production. Surplus areas of manure nutrients, mainly phosphorus, include Ostrobothnia, South Ostrobothnia, Satakunta and Southwest Finland. Approximately 20% of Finland’s manure phosphorus is formed in areas where the phosphorus quantity exceeds the requirement for crops. Manure phosphorus should be transported to other areas to replace conventional inorganic phosphorous fertilisers. Processing is usually required for transportation.[8]
National legislation influences the use of manure, and permitted levels of spreading vary from country to country, as does the quantity and nutrient content of manure. No clear statistical comparisons are currently available. The Nitrates Directive is probably the clearest common item of legislation covering the EU countries, but its application is highly varied, applying to the entire country in some cases, and only to certain areas in others. Even national implementation of the Directive varies.
The heavy metal contents of manure and sewage sludge tend to vary. According to an international review, sewage sludge generally has higher concentrations of heavy metals than manure.[9] In a comparison between Finland, Sweden and Germany, manure was generally found to have higher concentrations of heavy metals than superphosphate (excluding cadmium), while higher concentrations were found in sewage sludge than in manure. Heavy metal concentrations in the manure of various production animals in three countries were very similar, with the exception of zinc, which was found in higher concentrations in manure from Sweden.[10]
MTT Agrifood Research Finland’s Biosafe project investigated the relationship between harmful compounds and pharmaceutical concentrations in raw materials and residues in biogas plants, by calculating the correlation between them. There was no clear link between any harmful organic compound or group of compounds and individual feedstock. Hazardous organic compounds were found in the end products, whichever the raw material was – sewage sludge, municipal bio-waste, food processing by-products or manure. Biogas plant feedstock seemed to have a greater impact on pharmaceuticals than on other organic contaminants. The higher the proportion of sewage sludge in feedstock, the higher the concentrations of several pharmaceuticals were in the digestate. Antibiotics and antiparasitic pharmaceutical substances[11] used as animal medication, whose use in Finland is, however, very moderate in relation to many other countries (Use of antibiotics), find their way to biogas plants in animal manure.
In addition to the agricultural use of fertiliser products, harmful chemicals enter the soil as fallout from the atmosphere. According to the results of the BIOSAFE project, most chemical groups studied showed that the same degree of soil load was caused by spreading organic fertilisers on agricultural land and by fallout. Calculations based on concentration measurement analyses of Finnish sewage sludge and digestate show that the contaminant load due to the agricultural use of material is significantly higher than that of fallout, particularly for PBDE compounds (400 to 5,700 fold). In the case of PCB compounds too, the load caused by slurry spreading may be hundreds of times higher than the load caused by fallout. For PFAS compounds, it may be tens of times higher.[12]
In the RUSSOA project, contaminant concentrations were determined, for example in soil in areas where sewage sludge –based fertilisers are used. The observed concentrations were significantly higher than the reference area for PBDE compounds, pharmaceuticals and DEHP.[13]
Sewage sludge is thought to contain more specific harmful organic compounds than the manure of farm animals. For example, it can be assumed that concentrations of flame retardants and surface treatment agents are lower in manure than in municipal sewage sludge. In addition, the presence of pharmaceutical substances may differ between manure and sewage sludge. In Finland, antimicrobial agents are moderately administered to production animals compared to Europe in general, and the pharmaceuticals administered are narrow-spectrum (Use of antimicrobials), whereas antimicrobials are prescribed for humans more liberally.[14] In addition to pharmaceutical residues, sewage sludge contains residues of various organic compounds, such as flame retardants, etc., originating in households and industry. Sewage sludge also retains microplastics. It is estimated that the washing of textiles generates an annual load of 154 tonnes of chemical fibres for Finnish wastewater treatment plants.[15] It is thought that around 99% of this mass is retained in the resulting slurry.[16] According to rough estimates, as much as 150 tonnes of the some 150 thousand tonnes of sludge mass produced annually in Finland, i,e, one thousandth, consists of microplastics released from man-made fibre textiles. When microplastics from other sources are taken into account, the actual load can be assumed to exceed this estimate.
Limit values for heavy metals are defined in the EU Directive 86/278 on the protection of the environment, and in particular of the soil, when sewage sludge is used in agriculture. The Finnish fertiliser decree sets even lower limit values, in fact the most stringent in Europe.[17] A report by the EU Commission in the late 2000s investigated heavy metal concentrations in municipal sewage sludge. The total values calculated on the basis of the six partial figures for Finland were the lowest in the comparison. Concentrations of all individual heavy metals, except copper, were found to be lowest in Finland.
Heavy metal content in the sewage sludge recycled to agriculture (mg/kg of dry substance)
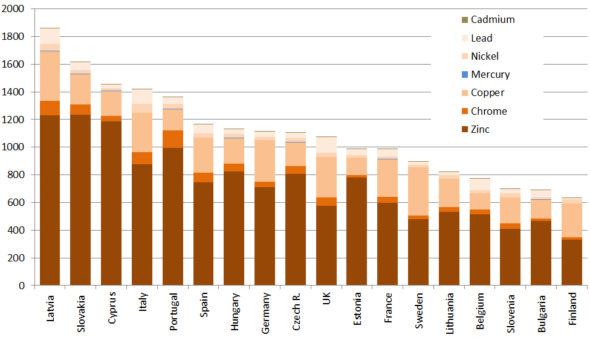 Source: Salado, R. et al. (2010) Environmental, economic and social impacts of the use of sewage sludge on land, Final Report, Part II: Report on Options and Impacts, European Commission, Link to the report
Sewage sludge spread on agricultural land is one of the few factors influencing the quality and purity of soil for which international comparative statistics are available. Variation is considerable between countries across Europe: 0 to 90% of sludge is allocated for agricultural purposes. The zero level in the Netherlands and Switzerland is explained by the fact that the use of sludge is either prohibited or most of it is burnt. In fact, combustion is one of the most common ways of treating municipal sewage sludge. Other methods used in Europe include composting, anaerobic digestion, landfilling, urban landscaping, landscaping and other uses. In the official comparative statistics for the 2010s, Finland is among the countries of low agricultural use, with a 5% share.
A recent survey by the Finnish Water Utilities Association (FIWA)[18] in the autumn of 2017, however, revealed a statistical error. In fact, one third of sewage sludge produced in Finland ended up on arable land in 2015, and up to 40% in 2016. The incorrect figures were partially due to the fact that, previously, wastewater treatment plants only reported agricultural use of sludge if the end user was clearly a farm owner. Batches that arrived in the fields through sludge-processing plants were not necessarily recorded as agricultural usage. The new survey was based on a direct questionnaire for processing plants, giving the total quantity of processed sludge as approximately 150 thousand tonnes, roughly the annual accumulation of Finland. The coverage of the survey is therefore undeniable. The contrast between old and new statistics is also explained by recent changes in the sludge market. The need for new ways of utilising municipal sewage sludge has arisen due to the prohibition on disposing of organic waste in landfills, which means that treated municipal sewage sludge can no longer be used for the covering layers of landfills. The need to cover landfills has also decreased as waste streams are directed towards combustion more often than before. The agricultural use of sludge has also been increased by the construction and commissioning of large biogas plants, which source raw materials from a wide area.
The use of sewage sludge in agriculture by country (%)
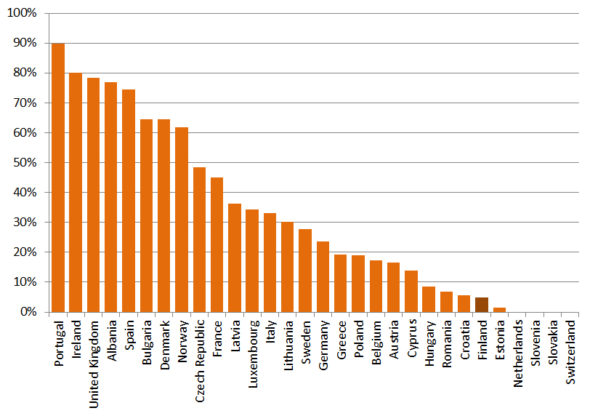 Source: Eurostat, Sewage sludge production and disposal data [env_ww_spd]. Note: figures from 2010-2015, the most recent available year from each country.
This statistical correction moves Finland drastically up the ranks, meaning that it is no longer a country that uses very small volumes of fertiliser products based on sewage sludge. Agricultural use of sludge exceeds 40% in only ten countries in the control group shown in the figure.
The results of the report intensified the already lively public debate in Finland. At present, there is no precise information on the extent to which pharmaceutical residues and chemicals accumulate in arable crops or where microplastics entering the soil in sludge end up, and in general what kind of risk factors the use of sludge in agriculture actually constitute. This uncertainty is increased by the fact that no limit values have been defined for the pharmaceutical residues of other chemicals. Several food chain operators, companies trading in grain and industrial companies have decided to restrict or completely refuse purchases of grain from fields in which sludge-based products had been used as fertilisers. These restrictions primarily apply to food grains and exported grains.
The agricultural usage volumes of sewage sludge in proportion to the available agricultural land in each country indicate the quantity of sewage sludge generated in relation to the country’s arable land area. The figure for 2015 published in a recent report was used for Finland. Hence, the average utilisation rate of municipal sewage sludge in agriculture was around 22kg/ha, being in the same category as the other Nordic countries except Norway. In fact, actual utilisation volumes per hectare are much higher in all countries, because sludge-based products are only use on a small, limited area of arable land.
Average sewage sludge use in agriculture (kg/ha); total sewage sludge use to utilized agricultural area (UAA)
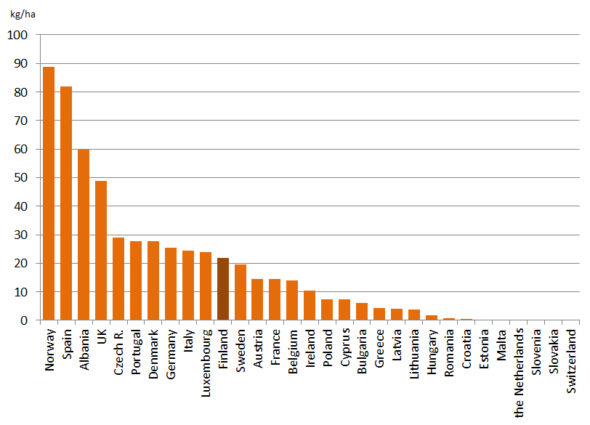
Source: own calculations based on Eurostat, Sewage sludge production and disposal data [env_ww_spd] and Utilised Agricultural Area [apro_acs_a]. Note: figures from 2010-2015, the most recent available year from each country.
If sewage sludge is not used on fields, but for landscaping or recreational areas, food safety concerns are resolved, but at the possible cost of exacerbating the risks to soil and the environment. If the use of sludge in agriculture decreases, viable alternative ways of exploiting it must be found. The Finnish technology industry has innovative solutions and is sure to create more.[19]
According to a number of indicators, the quality of Finland’s soil is among the best in Europe. The heavy metal contents of nutrients used on fields are strictly controlled. However, comprehensive international comparisons are required in the case of organic compounds and certain chemicals.
References
[1] Salminen, R. (ed) Geochemical Atlas of Europe, FOREGS, Link
[2] Samples were collected within the same short time interval using identical sampling schemes and equipment. Sample sites were equally distributed over Europe and samples were analysed in the same laboratory. More information
[3] Reimann C., Birke, M., Demetriades, A., Filzmoser, P., O’Connor, P. (2014) Chemistry of Europe’s Agricultural Soils, Part A Methodology and Interpretation of the GEMAS Data Set, 523 pages; Part B: General Background Information and Further Analysis of the GEMAS Data Set, 352 pages, Schweizerbart’sche Verlagsbuchhandlung, Stuttgart.
[4] Source of all maps on this page: Data DVD Reimann, C., Birke, M., Demetriades, A., Filzmoser, P. & O’Connor, P. (eds.) “Chemistry of Europe’s Agricultural Soils. Part A”; Geol. Jb., B 102; © 2014, BGR, Hannover, Germany.
[5] Birke, M. & Rauch, U. (2000) Urban Geochemistry: Investigations in the Berlin Metropolitan Area,Environmental Geochemistry and Health (2000) 22:233, Kluwer Academic Publishers.
[6] The current regulation is Regulation (EC) No 2003/2003 of the European Parliament and of the Council related to fertilisers.
[7] Press release of European Council, EU fertilisers: Council agrees terms of mandate, Link
[8] Marttinen, S., Venelampi, O., Iho, A., Koikkalainen, K., Lehtonen, E., Luostarinen, S., Rasa, K., Sarvi, M., Tampio, E., Turtola, E., Ylivainio, K., Grönroos, J., Kauppila, J., Koskiaho, J., Valve, H., Laine-Ylijoki, J., Lantto, R., Oasmaa, A., zu Castell-Rüdenhausen, Malin. (2007) Kohti ravinteiden kierrätyksen läpimurtoa: Nykytila ja suositukset ohjauskeinojen kehittämiseksi Suomessa, Natural Resources Institute Finland, 45/2017, 45 p. Link
[9] Bloema, E., Albihn, A., Elving, J., Hermann, L., Lehmann, L., Sarvi, M., Schaaf, T., Schick, J., Turtola, E. & Ylivainio, K. (2017) Contamination of organic nutrient sources with potentially toxic elements, antibiotics and pathogen microorganisms in relation to P fertilizer potential and treatment options for the production of sustainable fertilizers: A review, Science of the Total Environment 607–608 (2017) 225–242, p. 227.
[10] Sarvi, M., Ylivainio, K., Turtola, E. (2017) Report on environmentally relevant heavy metals in P-fertilizer materials, Link
[11] Marttinen, S., Suominen, K., Lehto, M., Jalava, T & Tampio, E. (2014) Haitallisten orgaanisten yhdisteiden ja lääkeaineiden esiintyminen biokaasulaitosten käsittelyjäännöksissä sekä niiden elintarvikeketjuun aiheuttaman vaaran arviointi – BIOSAFE-hankkeen loppuraportti, MTT Reports No 135, Link, p. 51
[12] Kasurinen V., Munne P., Mehtonen J., Türkmen A., Seppälä T., Mannio J., Verta M., Äystö L. 2014. Orgaaniset haitta-aineet puhdistamolietteissä. Finnish Environment Institute, Reports No 6/2014
[13] Fjäder P. 2016. Yhdyskuntajätevesilietteiden maatalouskäytön ja viherrakentamisen riskit – RUSSOA I-III Loppuraportti. Finnish Environment Institute, Reports No 43/2016 [14] Finland was situated to the middle of the ranking of ECDC (European Centre for Disease Prevention and Control), which included 30 European countries by their human use of antibiotics. Eleven countries had less antibiotic use than Finland in 2015. Link to the report
[15] Sillanpää M., Sainio P. 2017. Release of polyester and cotton fibers from textiles in machine washing. Environ Sci Pollut Res 24: 19313-19321.
[16] Talvitie, J., Mikola, A., Setälä, O., Heinonen, M., Koistinen, A. 2017. How well is microlitter purified from wastewater? A detailed study on the stepwise removal of microlitter in a tertiary level wastewater treatment plant. Water Research 109, 164–172.
[17] European Commission, Disposal and recycling routes for sewage sludge Part 2 – Regulatory report, p. 14
[18] Vilpanen, M. & Toivikko, S. (2017) Yhdyskuntalietteen käsittelyn ja hyödyntämisen nykytilannekatsaus, Finnish Water Utilities Association (FIWA) Publication nro 46, 38 p., Link to the publication (in Finnish)
[19] A recent example is Outotec’s investment in Zurich, Switzerland. To the article (in Finnish)
Photo in upper edge: Csaba Jansik