
Our result shows that genomic selection can be accurately implemented with much lower number of SNP markers than is currently available by many genotyping services. This was demonstrated by genomic evaluations of survival against infection of Flavobacterium columnare bacteria in rainbow trout. The creation of SNP panels consisting of 3,000-7,000 informative SNPs would be one way to reduce genotyping costs and to adopt genomic selection in more broodstocks worldwide.
Genomic selection is based on thousands of genome-wide DNA markers
Over the recent years, a large number of studies have demonstrated that the application of genomic selection significantly improves the response to selection of aquaculture breeding programmes.
In aquaculture breeding programmes, genomic selection is mainly used for traits that cannot be measured directly on the broodstock fish themselves. Such traits are for example product quality, processing yields or disease resistance traits that are measured on the full and half-sibs of the broodstock fish.
Genomic selection uses genome-wide DNA marker information, typically single nucleotide polymorphism (SNP), to estimate genomic breeding values of genotyped selection candidates, based on genotype and phenotype information gathered on their sibs and other relatives (referred to as a reference population).
However, genotyping cost is one key factor limiting the use of genomic selection in aquaculture species. For rainbow trout, genomic evaluations are commonly performed with a SNP panel consisting of circa 57,000 SNP markers.
Results
AquaIMPACT showed that reducing the SNP panel size to 7,000, or even 3,000 SNP markers in rainbow trout only slightly reduced the accuracy compared to the full 28,000 SNP marker panel (Fig. 1) A similar result has been observed in other projects with a wide variety of aquaculture species and for different traits (Fig. 2). This means that in rainbow trout, the currently used commercial SNP panel that has 57,000 SNP markers is more than enough for accurate genomic selection.
The price of genotyping depends on the number of SNP markers analysed, and on the volumes of individuals genotyped – the more samples to genotype, the lower the price. Hence one option to reduce genotyping costs is to generate a smaller, say 10-20,000 SNP marker panel. Or, perhaps develop a multi-species SNP panel which can have, for instance, 20,000 SNP markers for each of 3 different species (e.g. 3 different salmonid species). This expands the client basis considerably, and reduces the price of genotyping.
Why is 3000-7000 SNPs enough to obtain maximum selection accuracy in aquaculture species?
The use of 3,000 – 7,000 SNPs for genomic selection seems a low number, given that in livestock much larger numbers of SNP markers are used. Why would this be so?
In aquaculture breeding programmes, each generation typically consist of many large full- and half-sib families that are generated centrally in the nucleus. Each family is split, and the sibs of the future broodstock fish are tested for special traits such as disease resistance, product quality or slaughter traits. The sibs form the reference population in the genomic evaluation and the link between their DNA profile and the trait for which they are measured is then used to estimate the genomic breeding value value of the selection candidate using only their DNA profile (selection candidates are not measured for the trait).
Because the reference population and the breeding candidates are closely related, only a moderate number of SNP markers are needed to capture all genetic variation and to make accuracy breeding value estimation. Furthermore, in family-based breeding programme since the fish are closely related there is a low number of recombination and thus, most likely there are long linkage blocks in the genome. When the genome consists of long linkage blocks, fewer SNP markers are needed to cover the whole genome and accurately trace back the relationship between fish in the reference population and candidates.
In livestock and cattle in particular, selection is practiced across multiple generations and subpopulations, and the reference population animals are more distantly related to breeding candidates. Hence, it is expected that there is plenty of recombination in the data sets and linkage block are short.
Partners involved
The Roslin Institute and Royal (Dick) School of Veterinary Studies, University of Edinburgh, Edinburgh, United-Kingdom
Natural Resources Institute Finland (Luke)
Savon Taimen Oy
References
Fraslin C, Koskinen H, Nousianen A, Houston RD, Kause A. 2022. Genome-wide association and genomic prediction of resistance to Flavobacterium columnare in a farmed rainbow trout population. Aquaculture 557: 738332. https://doi.org/10.1016/j.aquaculture.2022.738332
Fraslin C, Robledo D, Kause A, and Houston RD. 2023. Potential of imputation for cost-efficient genomic selection for resistance to Flavobacterium columnare in rainbow trout. https://doi.org/10.1101/2023.01.04.522693
Kriaridou C, Tsairidou S, Houston RD, Robledo D. Genomic prediction using low density marker panels in aquaculture: performance across species, traits, and genotyping platforms. Front Genet 2020;11. https://doi.org/10.3389/fgene.2020.00124
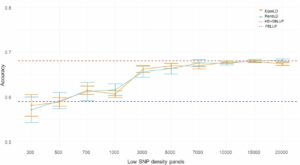
Figure 1. Accuracy of genomic prediction for resistance to F. columnare in rainbow trout, obtained with different low-density SNP panels (no imputation). The horizontal red dotted line is the average accuracy (0.68) based on the use of 28.000 SNP markers (after quality control) (HD-GBLUP). The horizontal blue dotted line is the average accuracy (0.59) for the pedigree-based prediction (PBLUP). The light blue line is the accuracy obtained with randomly sampling SNP markers (RandLD). The orange line is the accuracy obtained with the equally spaced SNP sampling (EquaLD). The mean (dots) and standard deviations (bars) are taken from 10 replicates of each marker density (Fraslin et al. 2023).
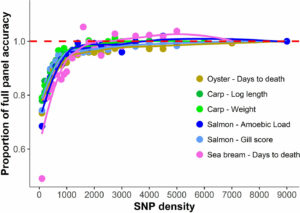
Figure 2. Genomic prediction accuracy using low-density panels. Mean accuracy and standard deviation of genomic prediction with different SNP densities in four aquaculture species (Kriaridou et al. 2020).